Astro-Stock-Forecast Software Graphs Services by Dr. Rajiv C. Karekar : The Ultimate Winning Edge for Investors and Traders


Sample Graphs Daily Swing

A picture is worth a thousand words!
 

As you must be aware that adage "A picture is worth a thousand words" refers very aptly to the idea that a complex idea can be conveyed with just a single still image. It also aptly characterizes one of the main goals of visualization, namely making it possible to absorb large amounts of data quickly.

Main feature of these Astro-Stock-Forecast Software Predictive Graphs in comparison to other predictive graphs available on net is its SIMPLICITY and OBJECTIVITY with no complicated subjective analysis!

 
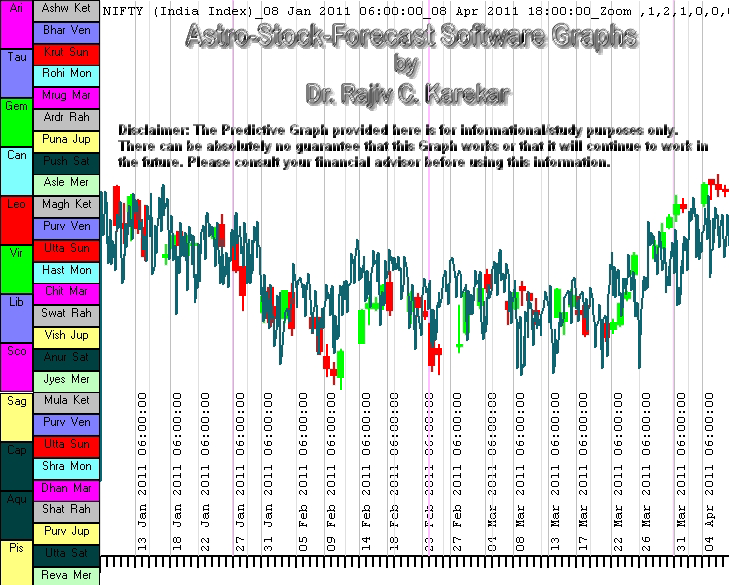
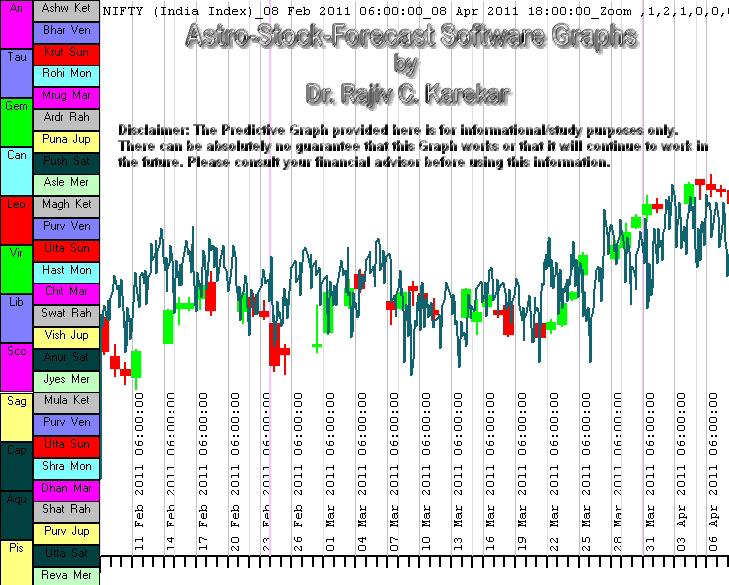
NIFTY (India Index)

The Teal graph line is Prediction and the Red Green Candle-sticks is actual Daily graph

3 Months Period (8 Jan 2011 to 8 Apr 2011)

2 Months Period (8 Feb 2011 to 8 Apr 2011)

1 Months Period (8 Mar 2011 to 8 Apr 2011)
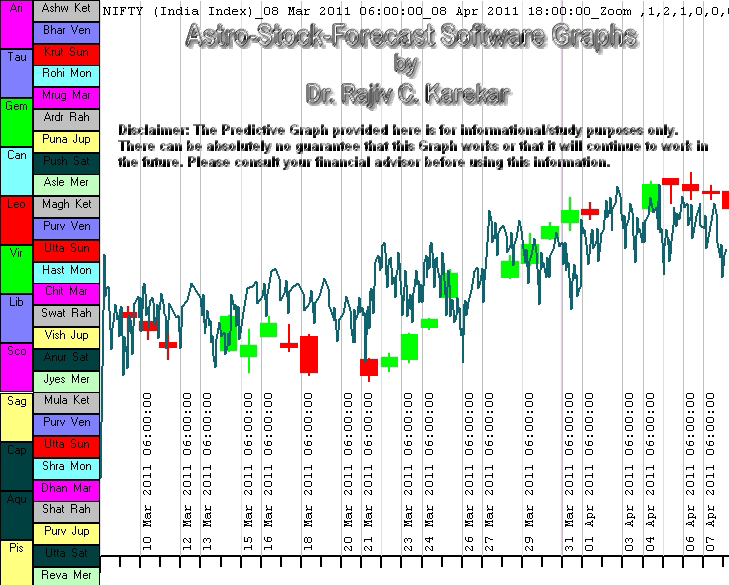


Very keen observers would notice that these graphs which are generated using Natal Chart Data DO NOT CHANGE  their internal pattern when the computation is done whether 1 or 2 or 3 months ahead of the start date.
This is brought to your notice since this scores high over all the neural network predictive graphs.